
segunda-feira, 8 de novembro de 2010
Gráfico de estradas pavimentadas brasileiras vs US
quinta-feira, 4 de novembro de 2010
Oferta Pública IPO KAROON

KRBR3 – KAROON PETRÓLEO & GÁS S.A
http://www.karoongas.com.au/
Para os interessados em participar do IPO sugiro ler o anual report da empresa que segue nos link abaixo.
http://karoon.republicast.com/ar2010/republicast.asp?page=1&layout=1&control=yes&zoom=100
Sobre a eleição do novo presidente da empresa
http://www.karoongas.com.au/Portals/0/PDF_Documents/News/2010/ApptClarkDavey.pdf
O que a empresa fala sobre entrar no Brasil leia mais.
http://www.karoongas.com.au/Portals/0/KAR%20South%20America%20Updated%20Volumes%20Estimated%20by%20D&M%20resubmitted.pdf
Volume Estimado pela D&M
http://www.karoongas.com.au/Portals/0/Karoon%20Listing%20of%20South%20American%20Assets%2009092010.pdf
Sobre a área de atuação da empresa no Brasil em Santos
http://www.karoongas.com.au/Projects/OffshoreSantosBasin/tabid/78/Default.aspx


Indices Mundiais em Alta

Indices Europeus e Asiáticos sobem com força pela manha de hoje.
Apesar do Ibov se encontrar na parte superior das BB a tendência principal continua autista.
quarta-feira, 3 de novembro de 2010
Acompanhe os principais índices mundiais em tempo real!

Para pessoas que sempre ouviram falar no famoso S&P500 e nunca tiveram a oportunidade de ve-lo durante um pregão aproveitem para dar uma olhada no site.
http://tools.boerse-go.de/index-tool/#Scene_
Nova Ferramenta de Cotações Já Disponivel
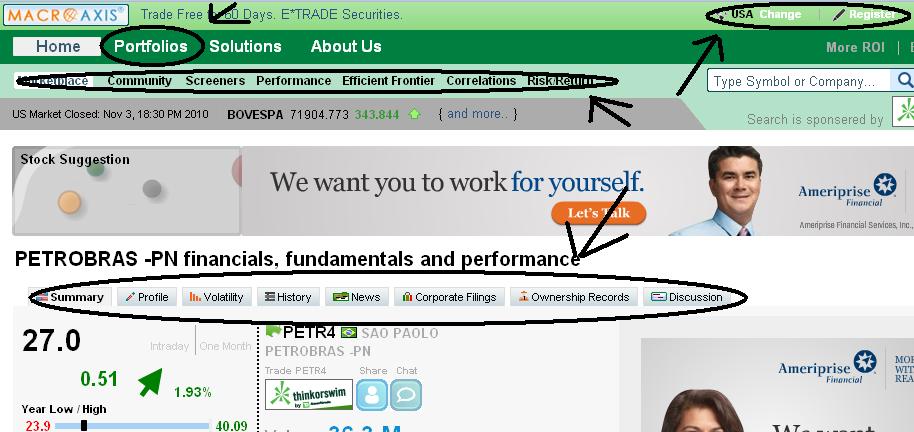
Com a nova ferramenta de cotações disponível no blog Diário de Operações é possível criar seu próprio Portfólio com ações do mundo inteiro, além disso a ferramenta permite ao usuário montar comparações, backtasting entre outras opções.
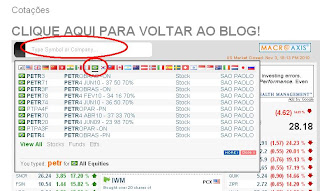

Para adicionar uma ação basta digitar o código do ativo e selecionar o pais respectivo dele como a imagem abaixo mostra.

Uma vez adicionada a ação desejada uma janela nova deve abrir com todas informações desse ativo.
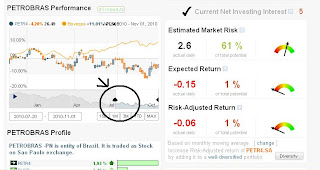
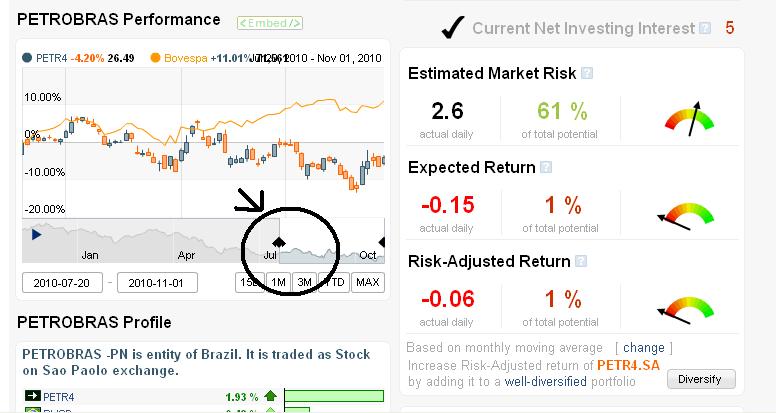
Para analisar o gráfico desse ativo basta arrastar a barra temporal na parte inferior dele.
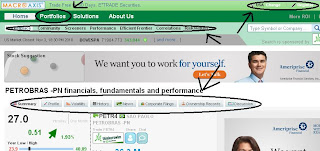
Agora para obter mais informações desse ativo ou criar seu Portfólio você precisa acessar o nome do ativo na parte superior direita da página.

Observe o menu superior novo que agora abriu, nesse menu você terá diversas opções para analisar ativos, criar portfolios e fazer backtasting. O mais importante para acessar tudo isso você pode criar uma conta ou usar sua conta do facebook.
Espero que o tutorial tenha sido bom.
Qualquer dúvida estou a disposição para ajudar.
Top 10 trading erros!

Hoje estava lendo um blog americano onde me deparei com essa matéria na qual achei muito interessante pois acredito que todo e qualquer trader que opere no mercado de forma regular já cometeu pelo menos algum desses "erros". Infelizmente a maioria deles são cometidos inúmeras vezes e repetidamente por muitos traders sem se darem conta do mesmo. Sendo assim resolvi posta-los aqui como um "review" para todos.
10. Acordar tarde e perder a abertura do mercado.
9. Operando numa tarde caótica tirando todos meus lucros da manhã.
8. Operando contra a tendência principal do mercado.7. Operando da abertura até o fechamento sem parar para almoçar ou sem algum intervalo, causando exaustão e baixa performance durante a tarde.
6. Deixar um scalp trade virar um short term trade ou até mesmo overnight.
5.Deixar um trader vencedor virar um perdedor.
4. Entrar em uma posição por impulso, não seguindo seu trading system.
3. Não respeitar a posição de seu stoploss ou não ter stoploss.
2. Se apegar a posições perdedoras.
1. Operar mais pesado que o tamanho de sua conta, trazendo desequilibrio emocional.
Outros extras erros
1.Não realizar lucro no target e esperar por um dia pior para realiza-los.
2. Abrir uma posição antes de algum compromisso que o impedirá de acompanhar o trade.
3.Abrir uma posição antes de algum dado econômico importante ser publicado.
quarta-feira, 27 de outubro de 2010
terça-feira, 26 de outubro de 2010
UK economy grows a faster-than-expected 0.8%

The UK's economy grew at 0.8% between July and September, official figures show, suggesting the economy is recovering faster than expected.
It follows 1.2% growth in the second quarter of the year, and is double the 0.4% expected by analysts.
Meanwhile rating agency Standard and Poor's upgraded its outlook for the UK's triple-A credit rating.
Chancellor George Osborne called both reports "a vote of confidence in the new government's economic policies"
The gross domestic product (GDP) figure released by the Office for National Statistics (ONS) is only a first estimate, and may be revised.
Analysts had expected a slowdown after weak retail sales and housing data.
Fonte: http://www.stocktrader.org.uk/stock-news.html
Fonte: http://www.stocktrader.org.uk/stock-news.html
Colour-code clue to Brazil's inflation past
If you want to know what living with hyperinflation in Brazil used to be like, an arcane system still used in many of the country's smaller record shops provides a clue.


 |
| Shopping in Brazil is less nerve-racking since inflation was tamed |
In place of a price-tag, each of the CDs on display in the racks has a small, round label attached. These come in a variety of colours.
To find out how much it actually costs, you have to consult a chart on the wall which quotes different prices according to the different colours of the stickers.
The reason? During the late 1980s and early 1990s, the price of everything in Brazil went up at least once a week and usually several times.
Since non-perishable goods such as CDs were likely to hang around in the shop for a while, it was easier to update the colour-coded chart than to change price-tags on every item.
Brazil's inflation no longer runs at 2,000% to 3,000% a year, as it did during the worst of times.
But the memory of those rampant price rises is so scarred into the minds of those who lived through them that some of the era's coping mechanisms live on.
Busted banks
 |
| Bradesco has continued to thrive since the end of hyperinflation |
Of course, all this changed abruptly in July 1994 with an inflation-busting economic plan that included the introduction of Brazil's current currency, the real.
Looking at Brazil today, it is difficult to remember just what a game-changing moment that was. In many sectors of the economy, it transformed winners into losers and losers into winners.
The biggest losers were some of the country's most established banks at the time, which had learnt how to thrive in times of high inflation.
The best of them had responded with innovations, such as sophisticated data links to speed up cheque clearance across the whole of Brazil's vast territory.
The worst were simply making a profit by holding on to the money a bit longer, delaying transfers so that the sum to be paid out was worth less than what had been paid in.
Those weaker banks were cruelly exposed once the easy returns from uncontrolled inflation dried up.
This led to a wave of bank failures, including the country's eighth-largest, Banco Economico, which had to be bailed out by the central bank in 1995 after it collapsed with debts of $3.6bn.
The sturdiest banks, such as Bradesco and Itau, have lived to see the 21st Century. On the other hand, they now have to contend with foreign rivals, such as HSBC and Santander, that entered the Brazilian market by taking over the weaklings.
New consumers
But while Brazil's banks were taking a hammering, the end of high inflation was a boon to those Brazilians who were too poor to have money saved in those institutions.
While prices were soaring, people at the bottom of the social scale simply had too little disposable income to be considered part of the consumer society.
When the economy stabilised, however, they acquired purchasing power for the first time - and suddenly, the new spending habits of the country's least fortunate citizens started to make an impact.
Sales of building materials went up, as the inhabitants of Brazilian favelas or shanty-towns upgraded their corrugated-iron and wooden shacks by replacing them with proper brick structures.
In 1995, Brazil manufactured a record 28 million tonnes of cement, more than half of which was bought by favela-dwellers.
And an entire class of people who had previously drowned their sorrows in the cheapest rot-gut cane spirit were able to switch to beer instead.
"Brazilians have certainly begun drinking more beer, because an enormous number of low-income consumers couldn't afford it before," advertising executive Flavio Nara of Brazil's DM9 agency told me two years after the Real Plan took effect.
As the man handling the account for Antarctica beer at the time, he was busy devising new ways of reaching out to these new consumers, whose importance has grown still further since then.
Continuity pays
The architect of the inflation-taming Real Plan, Finance Minister Fernando Henrique Cardoso, was rewarded by victory in the 1994 presidential election, followed by a second term in office four years later.
Those eight years under President Cardoso were not without their episodes of economic turmoil, notably the financial crisis of 1998-99 that led to a big devaluation.
But they provided Luiz Inacio Lula da Silva with a solid basis for his own two-term presidency - and it was Lula's decision to carry on with Mr Cardoso's economic policies, rather than changing course, that secured Brazil's current prosperity.
Now Lula's political heir, Dilma Rousseff, and Mr Cardoso's party colleague Jose Serra are getting ready to face each other in the second round of Brazil's latest presidential election on 31 October.
Either way, Brazil's economic policy seems set to continue on the same steady course, with both candidates committed to the successful Bolsa Familia welfare programme and wide-ranging infrastructure projects.
But if inflation had never been conquered, none of this would have been possible.
Lula himself is well aware of this. He has described the end of hyperinflation as "an extraordinary gain for salaried workers" and is proud of his achievement in combining growth with inflation control.
Faltering neighbours
Not all Brazil's neighbours have shown the same tenacity in trying to rein in galloping price rises.
Argentina had its own bout of hyperinflation in the late 1980s. Its solution was to link its currency, the peso, to the US dollar at a fixed one-to-one exchange rate.
That solved the country's immediate problems, but meant that its monetary policy was in effect decided in Washington rather than Buenos Aires, leaving it vulnerable to the economic crash that finally came in 2001-2002.
More recently, Argentina's inflation has been creeping up again, but the perceived response of President Cristina Fernandez de Kirchner's government has been to play fast and loose with the statistics.
Leading economists, consumers' groups and even staff at the national statistics agency have accused the government of manipulating the inflation figures.
The country's official rate of inflation for 2009 was 6.3%, according to the International Monetary Fund, but forecasters polled by the Consensus Economics survey organisation estimate that the true rate was 15.4%.
If those figures are accurate, then the only Latin American country with a higher inflation rate is another of Brazil's neighbours, Venezuela.
Its consumer prices went up 28.6% last year and the rate has accelerated since then, putting a dent in the popularity of President Hugo Chavez's "Bolivarian revolution".
By contrast, Brazil's inflation in 2009 was a mere 4.9%. Unlike its fellow South American nations, it has embraced left-leaning politics while maintaining tough anti-inflationary discipline - an approach which its electorate looks set to endorse at the polls.
Fonte: http://www.stocktrader.org.uk/stock-news.html
Fonte: http://www.stocktrader.org.uk/stock-news.html
Futuros e commodities no UK

Financial service
Banks
Utilities
Oil & Gas
segunda-feira, 25 de outubro de 2010
Brasil Ecodiesel anuncia negociação para fusão com Maeda
A Brasil Ecodiesel e a Maeda anunciaram nesta segunda-feira que estão em negociação para a fusão das atividades, de acordo com comunicado.
A informação foi divulgada após forte alta registrada pela ação da Ecodiesel na última sexta-feira.
"A administração da (Brasil Ecodiesel) comunica ao mercado que a relação de troca ora em discussão, e sujeita à aprovação das companhias e confirmação por instituição avaliadora, é de aproximadamente 3,6395 ações da Maeda para cada ação da Brasil Ecodiesel, o que implica atribuir à Maeda um valor econômico de aproximadamente 320 milhões de e cerca de 33 por cento da sociedade resultante da combinação", segundo a nota.
As empresas pretendem concluir as negociações até 31 de dezembro de 2010.
A informação foi divulgada após forte alta registrada pela ação da Ecodiesel na última sexta-feira.
"A administração da (Brasil Ecodiesel) comunica ao mercado que a relação de troca ora em discussão, e sujeita à aprovação das companhias e confirmação por instituição avaliadora, é de aproximadamente 3,6395 ações da Maeda para cada ação da Brasil Ecodiesel, o que implica atribuir à Maeda um valor econômico de aproximadamente 320 milhões de e cerca de 33 por cento da sociedade resultante da combinação", segundo a nota.
As empresas pretendem concluir as negociações até 31 de dezembro de 2010.
fonte: xp investimentos
sexta-feira, 22 de outubro de 2010
Desmistificando as estratégias da bolsa - Médias Móveis a Verdade - Parte 1
Para esse teste selecionei apenas blue ships, devido suas melhores rentabilidades passadas, volatilidade e liquidez. Além do mais que não vale nem apena perder o tempo tentando implementar mm em ativos que andam somente lateralmente e ou com pouca variação de preço ao longo do tempo.

 Resumo de desempenho
Imagem Ilustrativa da estratégia.
+10-25.jpg)
Os ativos testados serão PETR4 - VALE3 - IBOV - USIM5 - GGBR4.
Todos os ativos passarão pelas mesmas configurações de MM que são.
- 50/10 - 10/50
- 1/3 - 3/1
- 21/7 - 7/21
- 5/15 - 15/5
- 9/14 - 14/9
- 10/25 - 25/10
- 30/70 - 70/30
Todos os ativos foram analisados em gráficos diários uma vez que não possuo dados intraday em meu sistema de backtasting num período de 5 anos.
Os resultados:
IBOV:
Médias fast 10 e slow 25
Gráfico da evolução do capital desde 1 de julho de 2006 até a data deste post.
Gráfico Draw Down que mostra as principais perdas.
Resumo de desempenhoPerformance All Trades Long Trades Short Trades
Profit Factor 1,58 2,83 0,93
Cumulated Profit 46,56% 137,59% -38,32%
Max. Drawdown -42,13% -19,06% -38,99%
Sharpe Ratio 0,05 0,13 -0,07
Start Date 1/7/2005
End Date 21/10/2010
Total # of Trades 48 24 24
Percent Profitable 35,42% 54,17% 16,67%
# of Winning Trades 17 13 4
# of Losing Trades 31 11 20
Average Trade 1,33% 4,14% -1,48%
Average Winning Trade 12,13% 11,29% 14,86%
Average Losing Trade -4,59% -4,30% -4,74%
Ratio avg. Win / avg. Loss 2,64 2,62 3,13
Max. conseq. Winners 2 3 1
Max. conseq. Losers 6 4 7
Largest Winning Trade 46,91% 23,50% 46,91%
Largest Losing Trade -13,68% -10,70% -13,68%
# of Trades per Day 0,02 0,01 0,01
Avg. Time in Market 40,02 days 52,33 days 27,71 days
Avg. Bars in Trade 27,1 35,2 19,0
Profit per Month 0,61% 1,38% -0,78%
Max. Time to Recover 709,00 days 295,00 days 995,00 days
Average MAE 4,80% 4,37% 5,24%
Average MFE 9,56% 11,54% 7,59%
Average ETD 8,23% 7,40% 9,06%
Imagem Ilustrativa da estratégia.
+10-25.jpg)
Conclusão:
Foram efetuados 48 trades, 24 na posição comprada e 24 na posição vendida, desse total de 48 apenas 35,42% deles foram lucrativos ou seja apenas 17 trades.
Como a teoria dos mercados eficientes sugere que não é possível obter lucro constantemente utilizando qualquer estratégia de forma mecânica. Essa mais uma vez é comprovada pelos testes.
O lucro máximo acumulado foi de 100% provando que a estratégia não é eficiente de forma constante.
As posições compradas apareceram de forma mais eficiente do que as vendidas, sendo que 54% das posições compradas foram bem sucedidas enquanto que apenas 17% das vendidas foram eficientes.
A média de duração de uma posição são de 40 dias. Porém posição compradas são de 52,33 dias e posições vendidas são de 27,71 dias.
A média de lucro mensal total é de 0,61%. Para posições compradas é de 1,38% e posições vendidas -0,78%.
Outras informações podem ser tiradas a partir da tabela acima.
Em resumo, os dados mostram que a estratégia é mais eficiente no lado comprado.
De repente um saída para melhorar a performance é ignorar os sinais de venda. Operando somente no lado comprado. (Colocarei isso a teste em um outro post.)
E mais uma vez repito - Ganhos passados não são garantias de ganhos futuros.
Desmistificando estratégias "vencedoras"
Nesse artigo pretendo colocar a prova as estratégias mais clássicas da bolsa de valores.
Irei começar testando o cruzamento de médias móveis por ser a estratégia considerada mais funcional e uma das mais implementadas e indicadas para o uso.
Antes de começar a postar qualquer informação sobre meus testes gostaria de fazer um breve parênteses sobre a Teoria dos Mercados Eficientes, onde fala que nenhuma estratégia mecânica seria capaz de vencer o mercado por um longo período de tempo (em outras palavras a Teoria dos Mercados Eficientes sugere que é impossível de se obter ganhos acima dos do Mercado ao longo prazo). Ou seja uma estratégia pode ser vencedora por um determinado período ou determinada condição do mercado, porém se implementada de forma automática e constante essa estratégia acabaria devolvendo todo e qualquer ganho em excesso ao mercado.
Logo meu objetivo com esse estudo, é o de promover uma pesquisa sobre as grandes questões colocadas em muitos livros e levantada por milhares de investidores. É possível de se obter retornos maiores que o mercado como um todo? Existe alguma estratégia vencedora? Longo prazo ou especulação? A especulação no longo prazo é vencedora? entre outras milhares de conclusões que poderemos tirar a partir desse estudo.
Espero a participação e comentários de todos. Idéias e estratégias a serem testadas são bem vindas!
Muito Obrigado.
Assinar:
Postagens (Atom)
LinkWithin
